← Three.js from Scratch · all parts
Three.js from Scratch, Part 7: Faster Frames
Until now every demo in this series had a few dozen objects, and the frame rate took care of itself. Real scenes are not like that. A city has ten thousand windows, a forest has twenty thousand trees, a product configurator loads a new 4K texture every time someone clicks a colour. At some point the frame rate drops, the laptop fans start, and the question is no longer "how do I draw this" but "why is this slow, and what do I change".
This part is about answering that question with numbers instead of guesses. First we measure a frame and find out whether the CPU or the GPU is the bottleneck. Then we take the biggest CPU cost in most three.js scenes, draw calls, and cut it down three different ways: merging, InstancedMesh and BatchedMesh. Then the GPU side: levels of detail, frustum culling, pixels, textures and shadows. We finish with two things that are not about speed at all but bite every real app: freeing GPU memory, and not drawing frames nobody needs. Open the stress test and switch the modes; keep an eye on draw calls:
Open the demo full screen ↗ · Source on GitHub ↗
Everything uses Three.js r186 (npm version
0.186.1) and the classicWebGLRenderer, with the import map from Parts 1 to 4; the last section shows what changes onWebGPURenderer. Two r186 details matter here:THREE.Clockhas been deprecated since r183 in favour ofTHREE.Timer(we keep our own clock in the loop), andPCFSoftShadowMapis gone: setting it prints a warning and you getPCFShadowMap.
About the numbers in this article. The screenshots were taken in a headless browser with a software GPU (SwiftShader), so their frame times are far slower than on your machine, and the ranking of frame times can differ from a real GPU. Draw calls and triangle counts are exact and the same everywhere. Run the demos yourself: your own numbers are the ones that count.
Step 1: measuring a frame
Optimising without measuring is guessing. There are three tools worth knowing, from cheapest to most detailed.
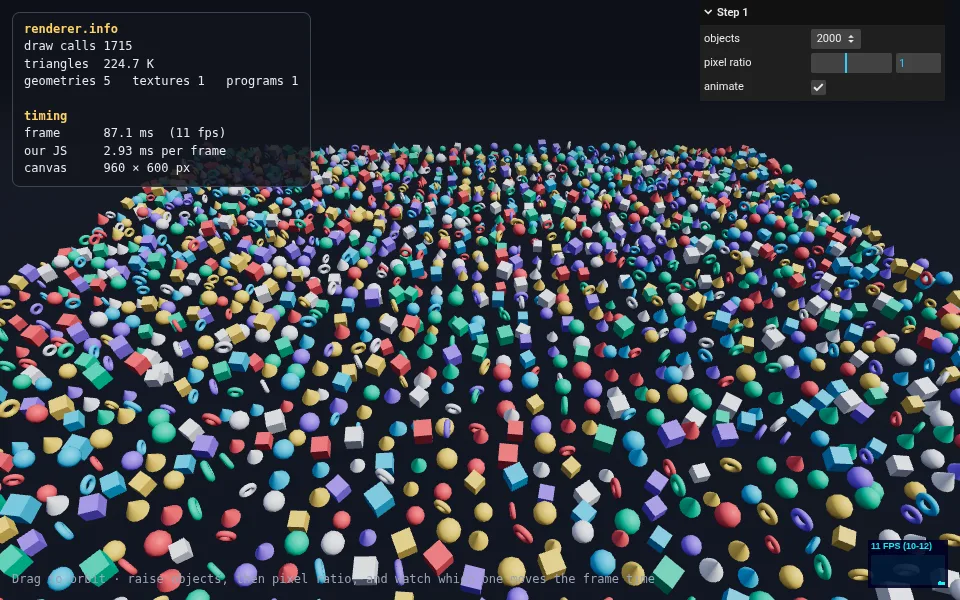
renderer.info. Every WebGLRenderer counts what it did:
renderer.info.render.calls       // draw calls in the last render()
renderer.info.render.triangles   // triangles drawn
renderer.info.render.frame       // how many frames so far
renderer.info.memory.geometries  // geometries that have GPU buffers right now
renderer.info.memory.textures    // textures uploaded to the GPU right now
renderer.info.programs.length    // compiled shader programs
One trap: info.autoReset is true, so render.calls and render.triangles are reset at the start of every render(). Read them right after you render, not in a setInterval. Shadow passes are drawn inside the same render(), so they are included. If you render several times per frame (a composer, a minimap), set renderer.info.autoReset = false and call renderer.info.reset() yourself once per frame.
stats.js. The little FPS graph you have seen in every three.js example ships with three:
import Stats from 'three/addons/libs/stats.module.js';
const stats = new Stats();
document.body.appendChild(stats.dom);
// in the loop:
stats.update();          // or stats.begin() ... stats.end() around your work; click it to switch to ms or MB
Our own timer. FPS alone hides where the time goes. Our demos time the JavaScript of each frame, our updates plus renderer.render(), and compare it with the time between frames:
function timed(work) {
  const t0 = performance.now();
  work();                                   // our updates + renderer.render()
  perfCpu += performance.now() - t0;
  perfFrames++;
  perf.calls = renderer.info.render.calls;  // read right after render()
  perf.triangles = renderer.info.render.triangles;
  // ...every 500 ms: frameMs = elapsed / frames, cpuMs = perfCpu / frames
}
renderer.render() does not wait for the GPU: it only queues commands. So "our JS" is CPU time, and "frame" is the time from one frame to the next, which includes waiting for the GPU.
CPU-bound or GPU-bound? A frame has two workers. The CPU runs your JavaScript and issues draw calls; the GPU then shades the triangles and pixels. Whichever is slower sets the frame rate, and the fix depends on which one it is:
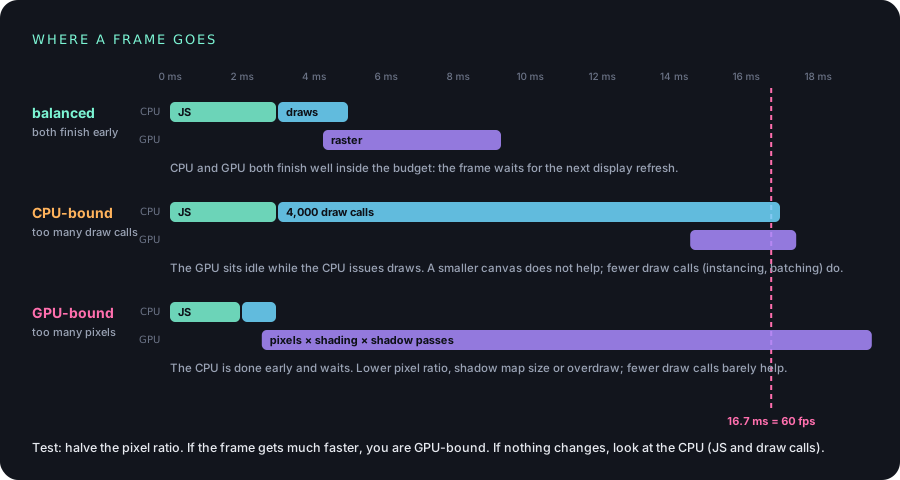
The quickest test is the pixel-ratio slider. Pixel ratio 0.5 means a quarter of the pixels. If the frame time drops a lot, the GPU was busy filling pixels. If nothing changes, the pixels were not the problem: look at the CPU, and usually at draw calls.
Chrome DevTools shows the rest. Open the Performance panel, press record for a few seconds, and stop. Each frame appears as an "Animation frame fired" task on the Main track: expand it and you see your loop, WebGLRenderer.render, and inside it renderBufferDirect once per object. The GPU track shows how long the GPU worked on each frame. A main thread full of tiny render calls is CPU-bound; a main thread that is mostly idle with a long GPU bar is GPU-bound. For the GPU in detail, Spector.js (a browser extension) records one frame and lists every single WebGL call.
Step 2: draw calls, and merging
A draw call is one "draw this geometry with this material" command from the CPU to the GPU. In three.js, each visible Mesh is at least one draw call (one per material group), and each shadow-casting mesh is one more per shadow map. Every call costs CPU time before the GPU even starts: three.js picks the shader program, binds buffers, uploads the object's matrices and material uniforms, and the browser validates all of it. A few hundred calls per frame are fine; ten thousand are not, even if each object is just 12 triangles.
Step 2 draws N objects in four shapes with ordinary meshes. Geometries and materials are shared, which saves memory but not draw calls:
const MATERIALS = PALETTE.map((color) => new THREE.MeshStandardMaterial({ color, roughness: 0.5 }));
const meshes = items.map((item) => {
  const mesh = new THREE.Mesh(SHAPES[item.shape], MATERIALS[item.color]);
  group.add(mesh);
  return mesh;
});
The oldest fix is to merge: bake every object, already moved to its place, into one big geometry. mergeGeometries from BufferGeometryUtils does it; the per-object colour becomes a vertex colour, so one material is enough:
import { mergeGeometries } from 'three/addons/utils/BufferGeometryUtils.js';

const parts = items.map((item) => {
  const part = SHAPES[item.shape].clone().applyMatrix4(matrixAt(item, 0, matrix));
  const colors = new Float32Array(part.attributes.position.count * 3);
  for (let v = 0; v < colors.length; v += 3) PALETTE[item.color].toArray(colors, v);
  part.setAttribute('color', new THREE.BufferAttribute(colors, 3));
  return part;
});
const geometry = mergeGeometries(parts);   // all parts need the same attributes
parts.forEach((part) => part.dispose());
const mesh = new THREE.Mesh(geometry, new THREE.MeshStandardMaterial({ vertexColors: true }));
5,000 objects become one draw call. The price: the objects are now just triangles. You cannot move one, hide one or pick one without rebuilding, the whole thing is culled as one object (so all 5,000 are drawn even when you look at ten), and the geometry holds every copy, so memory grows with N. Merging is perfect for static scenery: walls, rocks, a city that never moves.
mergeGeometries needs all geometries to have the same attributes, and either all or none indexed. That is why the box in our shape list has clearGroups() and the sphere is passed through mergeVertices().
Step 3: InstancedMesh
Most scenes with many objects have many copies of the same object: trees, bolts, bullets, chairs. InstancedMesh draws one geometry many times in one draw call, each copy with its own matrix (and optionally its own colour), using WebGL instancing. Unlike merging, every instance can still move:
const mesh = new THREE.InstancedMesh(geometry, material, count);
mesh.instanceMatrix.setUsage(THREE.DynamicDrawUsage);   // we rewrite it every frame
for (let i = 0; i < count; i++) {
  mesh.setMatrixAt(i, matrixAt(items[i], 0, matrix));
  mesh.setColorAt(i, PALETTE[items[i].color]);
}
mesh.computeBoundingSphere();                            // see below

// every frame:
for (let i = 0; i < count; i++) mesh.setMatrixAt(i, matrixAt(items[i], t, matrix));
mesh.instanceMatrix.needsUpdate = true;                  // upload the new matrices
One InstancedMesh = one geometry + one material. Our field has four shapes, so it takes four instanced meshes: four draw calls (five with the floor) for any N. The CPU work left is ours: computing N matrices in JavaScript. To change how many are drawn without reallocating, set mesh.count to anything up to the size you created it with.
Two things catch people out:
- Culling and the bounding sphere. An
InstancedMeshis frustum-culled as one object, using a bounding sphere around all instances. three.js computes it lazily the first time, and does not update it when you change matrices. Move instances far from where they started and the whole mesh can vanish at the edge of the screen. Callmesh.computeBoundingSphere()after big moves, or setmesh.frustumCulled = false. - Raycasting works and gives you
intersection.instanceId, but it tests every instance, so it is slow for very large counts.
Step 4: BatchedMesh
InstancedMesh needs one geometry. BatchedMesh (added in r159 and much improved since) takes many different geometries that share one material, and still draws them in one call. It stores every geometry once in a shared buffer, and then you add instances of any of them:
let vertices = 0, indices = 0;
for (const shape of SHAPES) { vertices += shape.attributes.position.count; indices += shape.index.count; }

const batch = new THREE.BatchedMesh(maxInstances, vertices, indices, material);
const geometryIds = SHAPES.map((shape) => batch.addGeometry(shape));   // each shape stored once
const ids = items.map((item) => {
  const id = batch.addInstance(geometryIds[item.shape]);
  batch.setMatrixAt(id, matrixAt(item, 0, matrix));
  batch.setColorAt(id, PALETTE[item.color]);
  return id;
});
The constructor is new BatchedMesh(maxInstanceCount, maxVertexCount, maxIndexCount, material): you reserve space up front. Other r186 methods you will want: setVisibleAt(id, bool), setGeometryIdAt(id, geometryId) to swap the shape of an instance (a cheap LOD), deleteInstance(id), optimize() to compact the buffers after deleting geometries, and setInstanceCount()/setGeometrySize() to grow it later.
How is that one draw call? Through the WEBGL_multi_draw extension: one call that draws a list of ranges from the shared buffer. Each frame, three.js builds that list on the CPU, and that is where BatchedMesh beats the other two:
perObjectFrustumCulled(defaulttrue): instances outside the view are left out of the list. Merged and instanced meshes are culled all or nothing.sortObjects(defaulttrue): opaque instances are sorted front to back, so the depth test can skip hidden pixels.setCustomSort()replaces the sort.
Both cost CPU time per instance, and the demo has toggles for them. Where WEBGL_multi_draw is missing, three.js falls back to a loop of ordinary draws, which still saves all the per-object setup.
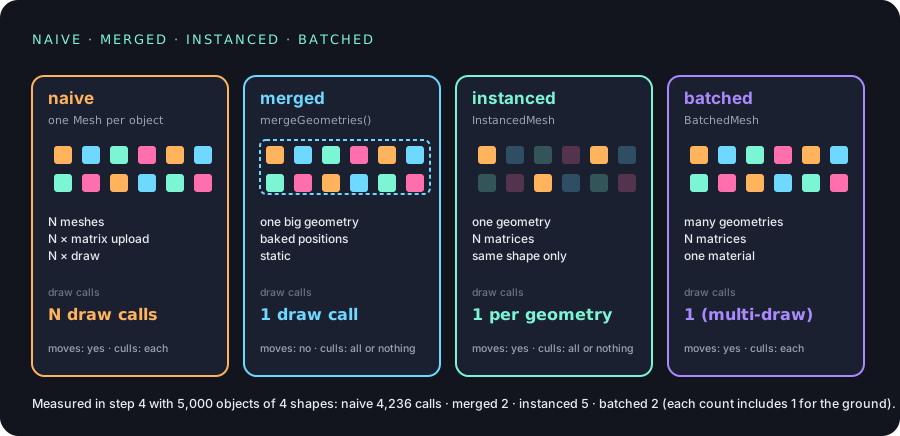
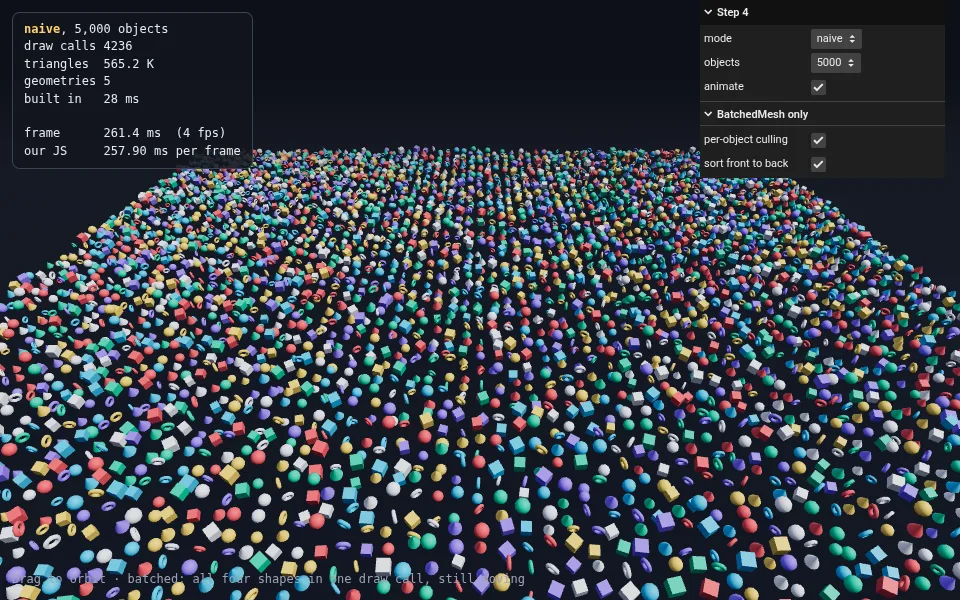
Here are the four modes of step 4 side by side, 5,000 objects, the camera from the screenshots:
| mode | draw calls | triangles | our JS per frame |
|---|---|---|---|
| naive | 4,236 | 565 K | 248 ms |
| merged | 2 | 662 K | 0.2 ms (but 388 ms to build) |
| instanced | 5 | 662 K | 1.0 ms |
| batched | 2 | 565 K | 1.8 ms |
The "our JS" column is the one that tells the story, and it is CPU time, so it is far less distorted by the software GPU than the frame time. Two more things to read in it: merged and instanced draw more triangles than naive, because they cannot leave out the objects behind the camera, and only batched gets both one call and per-object culling. Batched spends a little more JavaScript than instanced on that culling and sorting.
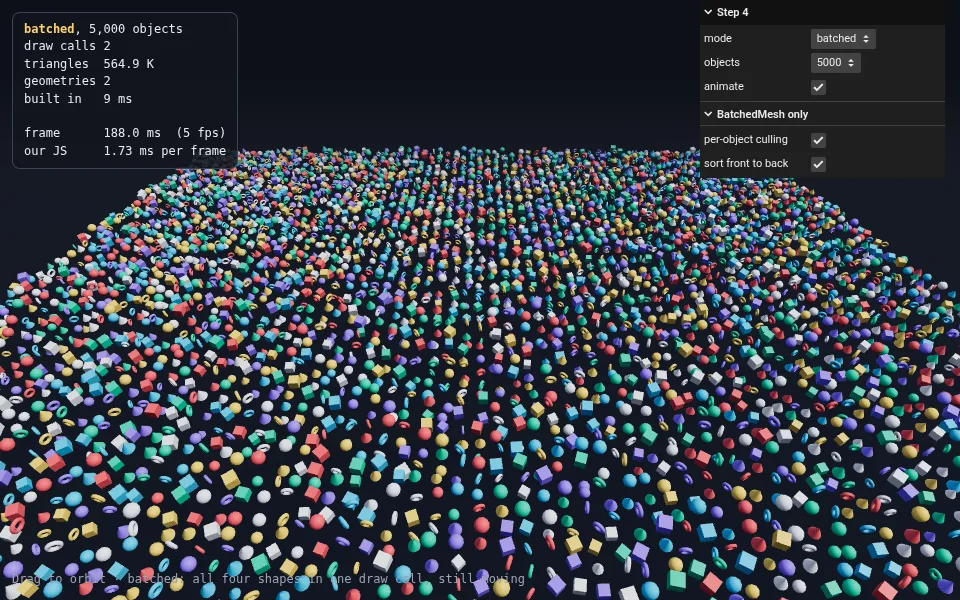
Which one to use:
- A few hundred objects: plain meshes. Do not optimise what is not slow.
- Static scenery: merge it, maybe per area so culling still works per chunk.
- Many copies of one thing that move:
InstancedMesh. - Many different shapes with one material that move, appear and disappear:
BatchedMesh. - Different materials: group by material; each group is one instanced or batched mesh. Fewer materials is a win of its own (a texture atlas instead of ten textures).
Step 5: LOD and frustum culling
Draw calls are the CPU side. On the GPU side, the first question is: why draw triangles nobody can see?
Frustum culling is on by default. Before drawing, three.js tests each object's bounding sphere against the camera's view volume (the frustum) and skips the ones outside. You turn it off per object with object.frustumCulled = false, which you sometimes need for objects whose vertex shader moves them far from their geometry (Part 4 and 5 style).
LOD (level of detail) is for the objects that are visible but far away. A sphere 100 metres away covers 20 pixels; 8,820 triangles is a waste there. THREE.LOD holds several versions of an object and shows one, chosen by distance to the camera:
const LEVELS = [
  { geometry: new THREE.IcosahedronGeometry(1, 20), distance: 0 },    // 8,820 triangles
  { geometry: new THREE.IcosahedronGeometry(1, 5),  distance: 18 },   //   720 triangles
  { geometry: new THREE.IcosahedronGeometry(1, 1),  distance: 45 },   //    80 triangles
];
const lod = new THREE.LOD();
for (const level of LEVELS) {
  // hysteresis 0.1: switch back only 10% past the distance, so objects on the line do not flicker
  lod.addLevel(new THREE.Mesh(level.geometry, material), level.distance, 0.1);
}
scene.add(lod);
lod.autoUpdate is true, so the renderer calls lod.update(camera) for you each frame; lod.getCurrentLevel() tells you which level is showing. In a real project the lower levels come from your 3D tool, or from a simplifier: three ships SimplifyModifier, and glTF-Transform and meshoptimizer can simplify whole models offline.
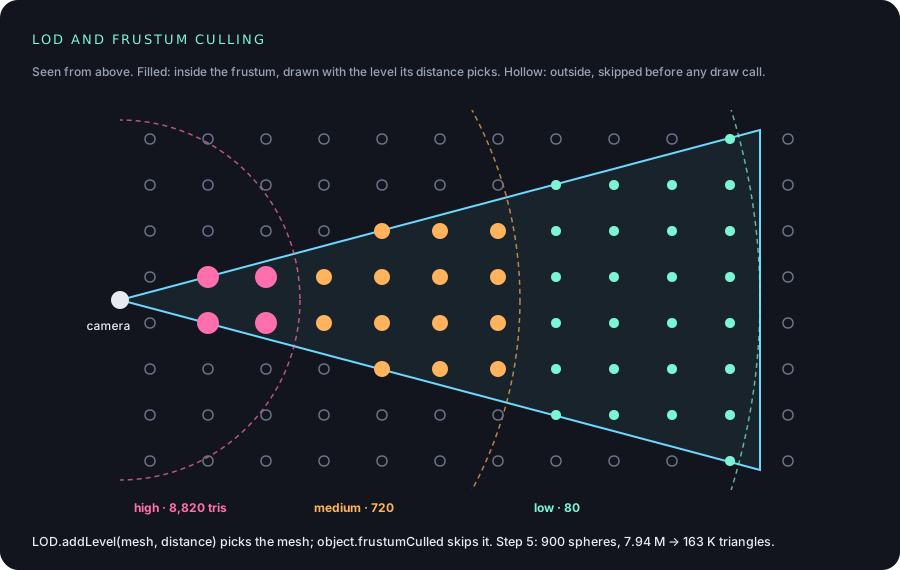
Step 5 has 900 spheres. With both on, 459 draw calls and 163 K triangles (45 spheres high, 215 medium, 640 low). With both off, 901 draw calls and 7.94 million triangles for the same picture: almost fifty times as much work for the vertex shader.
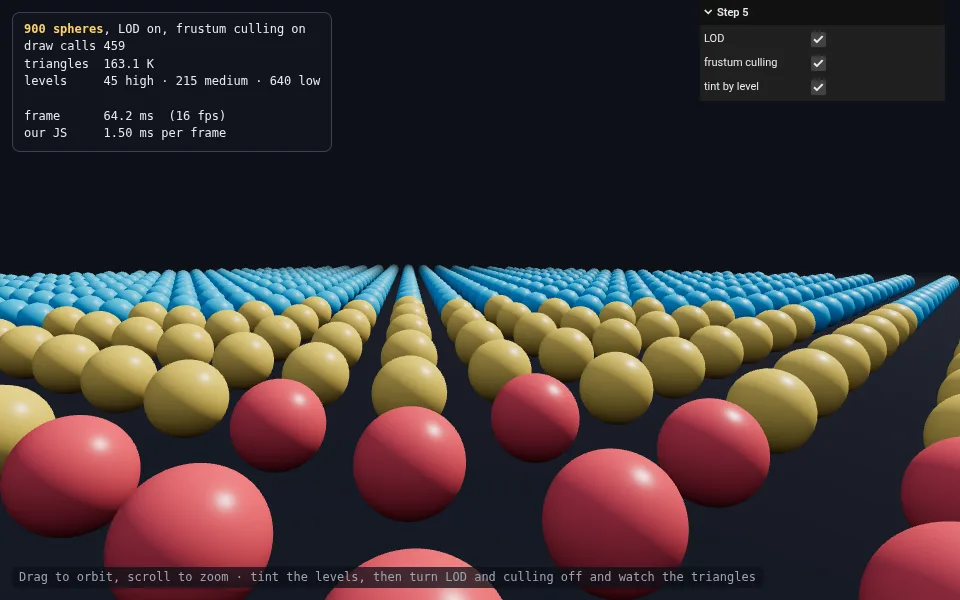
LOD is one more object per sphere, so it does nothing for draw calls. With thousands of objects, combine the ideas: BatchedMesh.setGeometryIdAt(id, lowGeometryId) swaps an instance to a cheaper geometry without leaving the single draw call.
Step 6: pixels, textures and shadows
The rest of the GPU's work scales with pixels, and the numbers grow fast.
Pixel ratio. renderer.setPixelRatio(devicePixelRatio) on a phone with a ratio of 3 renders nine times as many pixels as ratio 1. Every demo in this series caps it with Math.min(devicePixelRatio, 2). On phones or for heavy scenes, 1.5 or even 1 is often the best trade: fewer pixels beat any shader trick. Some apps lower it automatically when the frame rate drops.
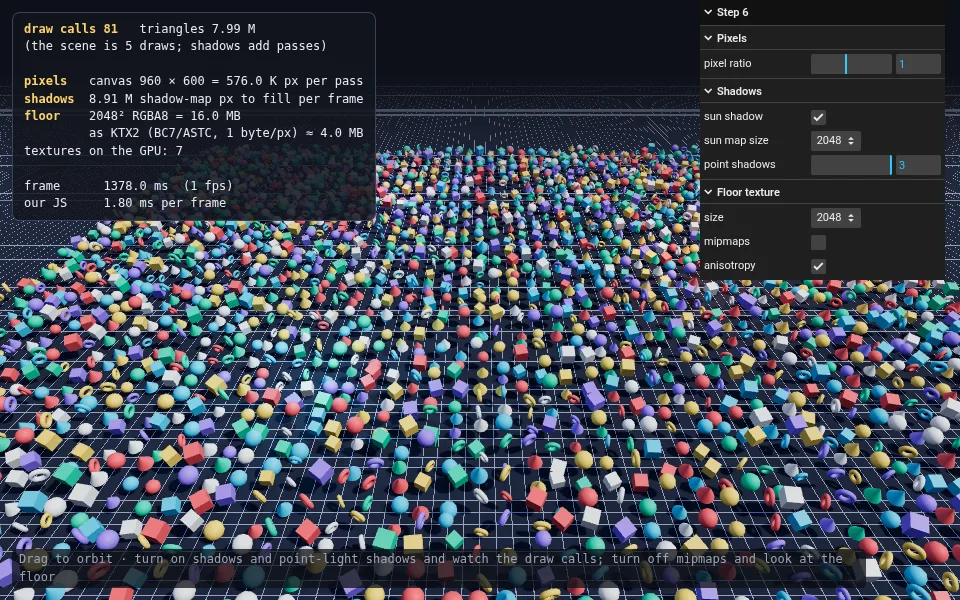
Textures cost memory and bandwidth. A 2048 × 2048 texture is 4 million pixels; as ordinary RGBA8 that is 16 MB of GPU memory, 21 MB with mipmaps, no matter how small the PNG or JPEG was: the GPU stores pixels, not files. Three rules:
- Use the size you need. A texture never seen larger than 512 pixels on screen does not need to be 4096.
- Keep mipmaps (
generateMipmapsis on by default). They are the texture pre-shrunk to half, quarter and so on. Without them a far-away floor reads random texels and shimmers, and costs more bandwidth. Turn mipmaps off in step 6 and look at the floor.texture.anisotropy = renderer.capabilities.getMaxAnisotropy()keeps floors at a grazing angle sharp. - Use compressed textures: KTX2. GPU formats like BC7 (desktop), ASTC and ETC2 (mobile) stay compressed in GPU memory, typically 4 to 8 times smaller than RGBA8, and are read without decompressing. KTX2 with Basis Universal is one file that three.js transcodes to whatever the device supports:
import { KTX2Loader } from 'three/addons/loaders/KTX2Loader.js';

const ktx2 = new KTX2Loader()
  .setTranscoderPath('https://cdn.jsdelivr.net/npm/three@0.186.1/examples/jsm/libs/basis/')
  .detectSupport(renderer);             // which GPU formats this device has
const texture = await ktx2.loadAsync('floor.ktx2');
texture.colorSpace = THREE.SRGBColorSpace;
You make KTX2 files with KTX-Software's toktx, or for whole glTF models with gltf-transform etc1s or uastc (Part 3 used such a model with GLTFLoader.setKTX2Loader). The status box of step 6 shows the difference for our floor: about 16 MB as RGBA8, about 4 MB at one byte per pixel.
Shadows are extra renders. A light with castShadow renders the scene again, from the light, into its shadow map, every frame. A DirectionalLight or SpotLight is one extra pass; a PointLight renders a cube, six passes. In step 6, the scene is 5 draw calls; with the sun's shadow it becomes 9, and with three shadow-casting point lights 81, and 8 million triangles. What helps:
- As few shadow-casting lights as possible, ideally one. Fake the rest with baked lightmaps or a soft blob texture under each object.
castShadowonly on objects whose shadow you can see;receiveShadowonly where it lands.- A shadow camera that fits the scene tightly (Part 3), so a smaller
shadow.mapSizelooks just as sharp. - For a static scene,
renderer.shadowMap.autoUpdate = false, andrenderer.shadowMap.needsUpdate = truewhen something moves.
Two r186 notes from writing this step: switching renderer.shadowMap.enabled at runtime needs material.needsUpdate = true on every material, because shadows change the shaders; and changing shadow.mapSize on a light that already rendered needs light.shadow.map.dispose(); light.shadow.map = null; so three.js makes a new map with the new size.
Step 7: dispose(), and rendering on demand
Memory leaks
scene.remove(mesh) takes an object out of the scene graph. It does not free anything on the GPU. The vertex buffers three.js made for the geometry, the uploaded textures and the compiled programs all stay, because three.js cannot know whether you will add the object back. In a single page app that loads levels, products or map tiles, that is a leak that ends with a lost WebGL context or a crashed tab on a phone.
You free GPU resources with dispose(), on each geometry, material and texture:
function disposeTree(root) {
  root.traverse((object) => {
    if (!object.isMesh) return;
    object.geometry.dispose();
    const materials = Array.isArray(object.material) ? object.material : [object.material];
    for (const material of materials) {
      for (const value of Object.values(material)) if (value?.isTexture) value.dispose();
      material.dispose();
    }
  });
}

scene.remove(level);
disposeTree(level);
Do not dispose things that are still shared with other objects; shared geometries and materials are disposed once, when the last user is gone. Other things with a dispose(): render targets, InstancedMesh and BatchedMesh (their own buffers), controls, PMREMGenerator, composers and passes (Part 6), and finally renderer.dispose().
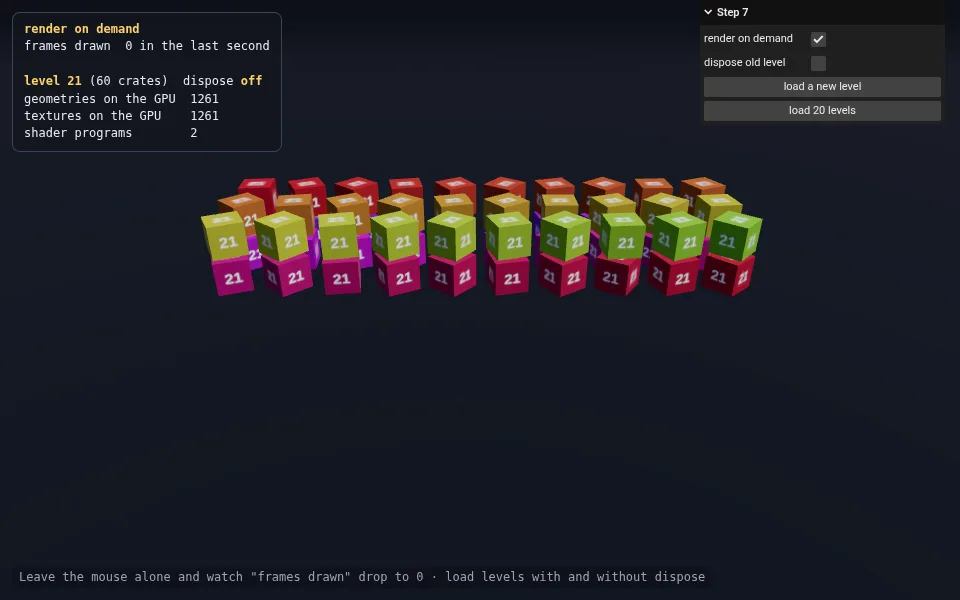
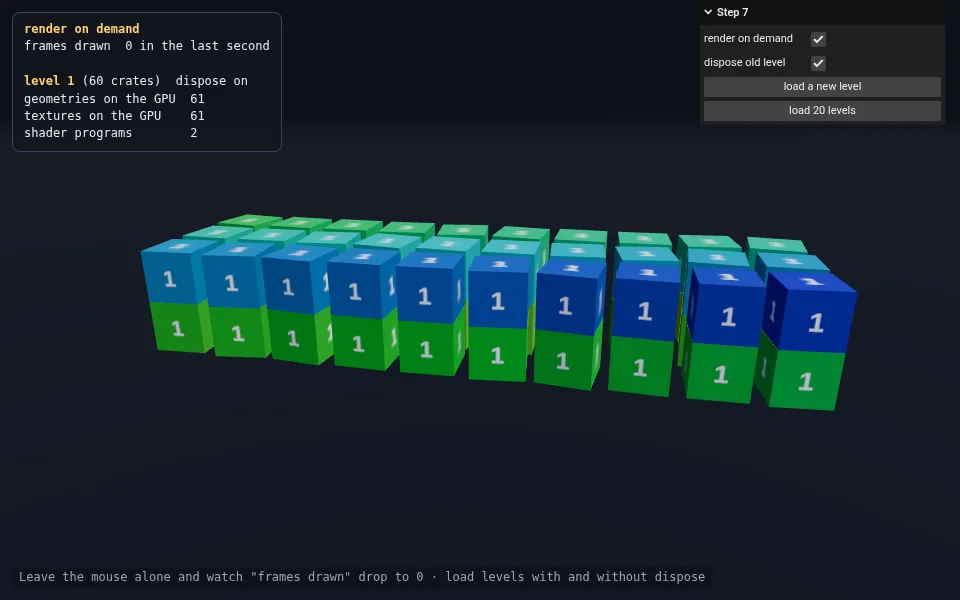
renderer.info.memory is the leak detector. Step 7 loads "levels" of 60 crates, each with its own geometry and canvas texture. With dispose old level on, the counts stay at 61 geometries and 61 textures, however many levels you load. Turn it off and press load 20 levels: 1,261 of each, and climbing.
Render on demand
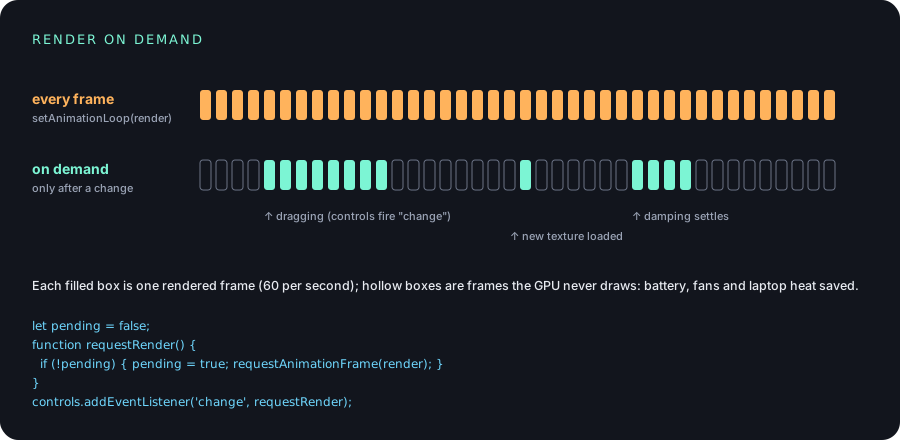
Every demo so far has drawn 60 frames a second with setAnimationLoop, even when nothing moved. For a product viewer, a map or a dashboard, most of the time nothing does move, and those identical frames cost battery, heat and fan noise. Render on demand draws only when something changed:
let needsRender = true;
function requestRender() { needsRender = true; }
controls.addEventListener('change', requestRender);   // fires while you drag, and while damping settles
addEventListener('resize', requestRender);
// also call requestRender() after loading something, changing a material, etc.

renderer.setAnimationLoop(() => {
  controls.update();              // cheap; with damping it keeps firing 'change' for a moment
  if (!needsRender) return;
  needsRender = false;
  renderer.render(scene, camera);
});
The loop still runs, but it costs almost nothing when it returns early. controls.update() must keep running so damping can finish its glide. If you prefer no loop at all, schedule a single requestAnimationFrame(render) from requestRender() instead, as in the diagram. Either way, anything that animates, a mixer, a shader with time, a camera tween, has to keep requesting frames while it runs.
Leave the mouse alone in step 7 and "frames drawn" falls to 0 per second.
The final demo: the stress test
The demo at the top puts the four ways of step 4 into one stress test:
- mode: naive, merged, instanced or batched, built from the same seeded list of objects, so every mode draws exactly the same field.
- objects: 1,000 to 50,000. Try naive at 20,000, then batched.
- animate, sun shadows and pixel ratio, to move the load between CPU and GPU.
- batched: per-object culling, to see what it costs and saves.
- benchmark all modes: runs each mode for 1.2 seconds at the current object count and prints a table of draw calls, frame time and JavaScript time.
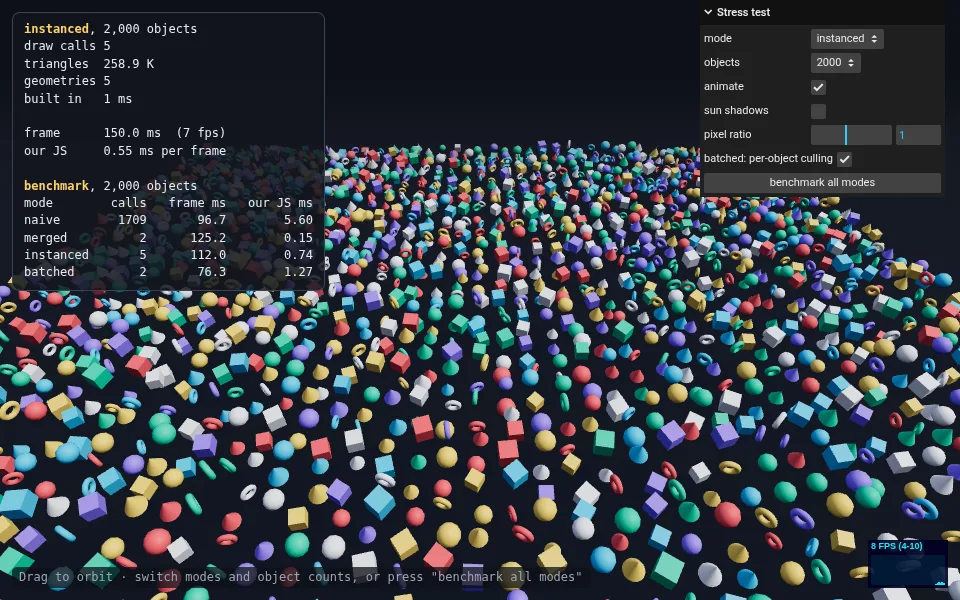
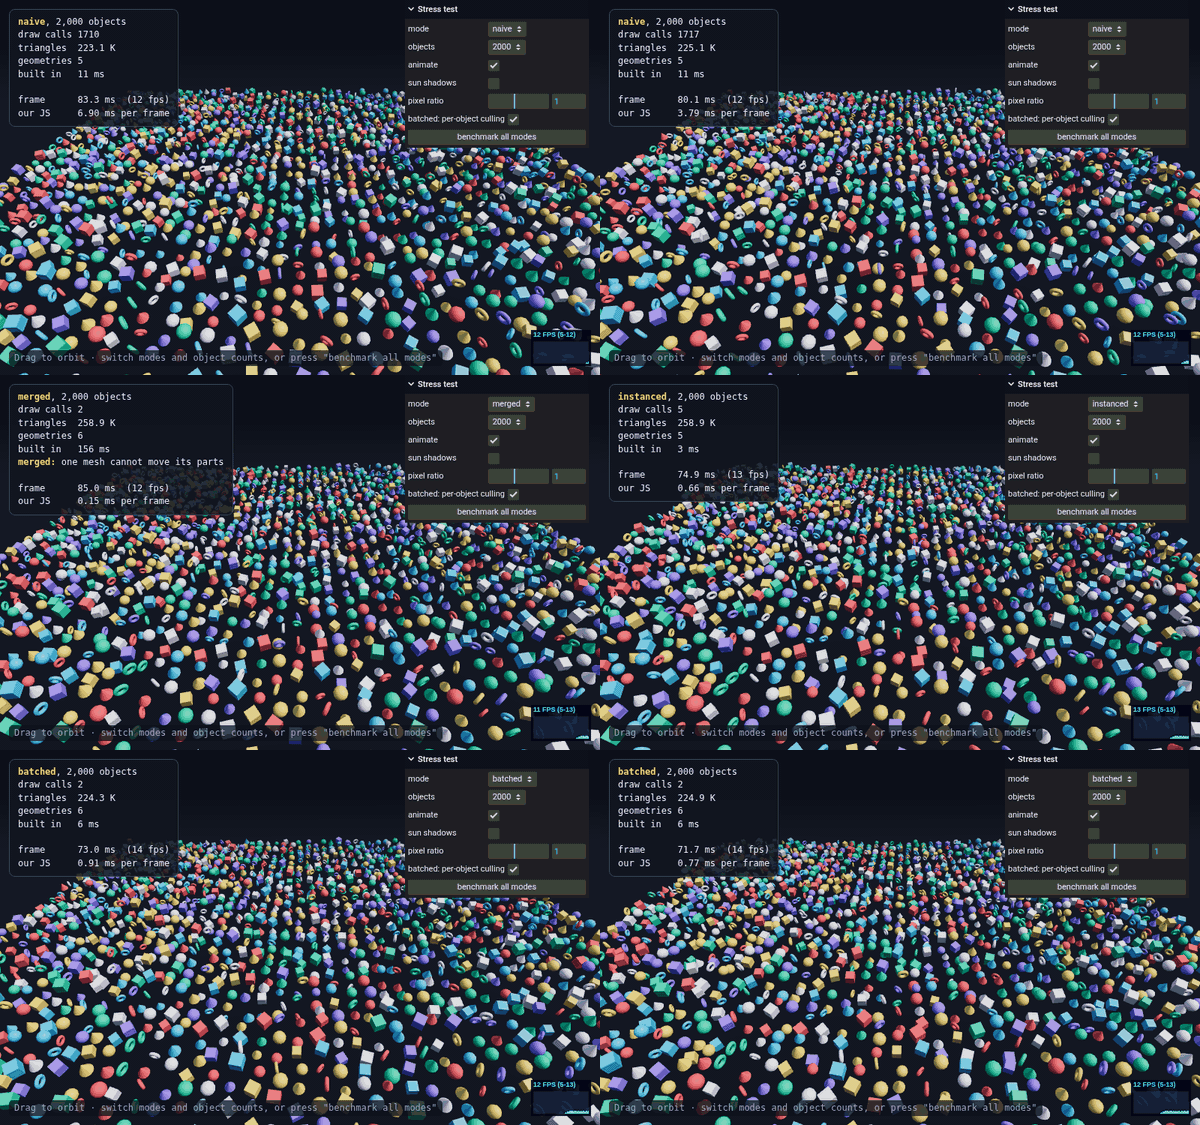
This screenshot is a good example of why you measure on the real target. On SwiftShader, filling pixels on the CPU costs so much that the frame time barely follows the draw calls, and the merged mode, which draws every object including those behind the camera, is the slowest. On a real GPU the pixel work is cheap, and the 1,709 draw calls of the naive mode are what you feel. The JS column, 5.6 ms against 0.15 to 1.3 ms, is the same story on any machine.
WebGPURenderer: what changes
Everything in this article applies to WebGPURenderer from Part 5: draw calls, instancing, BatchedMesh, LOD, culling, pixel ratio, textures, shadows, dispose() and render on demand work the same way, with the same classes. WebGPU makes each draw call cheaper for the browser to validate, but it does not make 10,000 of them free; three.js still does its per-object work in JavaScript. What differs is mostly the measuring:
import * as THREE from 'three/webgpu';

const renderer = new THREE.WebGPURenderer({ antialias: true, trackTimestamp: true });
await renderer.init();

renderer.setAnimationLoop(() => {
  renderer.render(scene, camera);
  renderer.info.render.drawCalls;    // draw calls this frame (on WebGL: info.render.calls)
  renderer.info.render.triangles;
  renderer.resolveTimestampsAsync('render').then((ms) => {
    if (ms !== undefined) gpuMs = ms;   // real GPU time in ms, where the device supports it
  });
});
trackTimestamp: true asks the GPU itself how long rendering took, using timestamp queries where the browser offers them (timestamp-query on WebGPU, a timer extension on the WebGL 2 fallback). That is the clean answer to "am I GPU-bound", which WebGLRenderer cannot give you out of the box. One naming trap: on WebGPURenderer, info.render.calls is the number of render() calls since the app started, and info.render.frameCalls the number of render() calls this frame; the draw calls are info.render.drawCalls. And compute shaders (Part 5) open a new option for huge counts: move the per-object update itself to the GPU, so the CPU writes nothing per frame.
When it goes wrong: common pitfalls
Measuring
renderer.info.render.callsis always 0 or tiny. You read it in a timer or before rendering. It is reset at the start of everyrender(); read it right after. With several renders per frame, useautoReset = falseandinfo.reset().- The frame rate is stuck at exactly 60 (or 120). That is the display's refresh rate, not your scene's limit. Compare the JavaScript time with the 16.7 ms budget, or test with more objects.
- Numbers differ wildly between machines. They should. Measure on the slowest device you care about, often a mid-range phone, not on your development machine.
Instancing and batching
- Instances disappear at the edge of the screen. The
InstancedMeshbounding sphere is from the first frame. CallcomputeBoundingSphere()after moving instances, or setfrustumCulled = false. - Changed matrices do nothing. You forgot
mesh.instanceMatrix.needsUpdate = true(orinstanceColor.needsUpdatefor colours).BatchedMesh.setMatrixAtneeds no flag. BatchedMeshthrows when adding. It is full: the vertex, index or instance counts you reserved in the constructor are used up. Reserve more, or grow it withsetGeometrySize()andsetInstanceCount().mergeGeometriesreturnsnulland logs an error. The geometries have different attributes, or some are indexed and some not. Make them match (toNonIndexed()ormergeVertices(),deleteAttribute()).
GPU and memory
- Shadows look blocky after the update to r186.
PCFSoftShadowMapwas removed and falls back toPCFShadowMapwith a warning. UsePCFShadowMapand tuneshadow.radius, orVSMShadowMap. - Turning shadows on at runtime does nothing. Materials compiled without shadows; set
material.needsUpdate = trueon them. - Memory grows every time you switch a page or level.
renderer.info.memoryclimbs: something is removed but not disposed. Dispose geometries, materials, textures and render targets. - The tab crashes on phones with big textures. Count the memory: width × height × 4 bytes, plus a third for mipmaps. Use smaller or KTX2 textures.
Render on demand
- The picture freezes halfway through a camera glide. Damping needs
controls.update()every frame, even when you do not render; keep calling it. - A loaded model or texture only appears after you move the mouse. Call
requestRender()when loading finishes.
The full code
This is the final stress test, demos/part-7/index.html, in one file:
<!doctype html>
<html lang="en">
<head>
  <meta charset="utf-8">
  <meta name="viewport" content="width=device-width, initial-scale=1">
  <title>Part 7 · Stress test: naive, merged, InstancedMesh and BatchedMesh</title>
  <style>
    html, body { margin: 0; height: 100%; background: #0d1017; overflow: hidden; }
    canvas { display: block; }
    .panel { position: absolute; left: 12px; top: 12px; max-width: calc(100% - 48px); font: 400 12px/1.45 ui-monospace, Menlo, Consolas, monospace; color: #e7eaf0; background: rgba(18, 21, 29, .85); border: 1px solid #3a4258; border-radius: 8px; padding: 8px 11px; white-space: pre; overflow: hidden; }
    .panel b { color: #ffd166; font-weight: 600; }
    .hint { position: absolute; left: 12px; bottom: 12px; max-width: calc(100% - 120px); font: 400 12px/1.45 ui-monospace, Menlo, Consolas, monospace; color: #9aa3b5; pointer-events: none; background: rgba(13, 16, 23, .75); padding: 2px 7px; border-radius: 5px; }
  </style>
  <script type="importmap">
    {
      "imports": {
        "three": "https://cdn.jsdelivr.net/npm/three@0.186.1/build/three.module.js",
        "three/addons/": "https://cdn.jsdelivr.net/npm/three@0.186.1/examples/jsm/"
      }
    }
  </script>
</head>
<body>
  <div id="status" class="panel">Starting…</div>
  <div class="hint">Drag to orbit · switch modes and object counts, or press "benchmark all modes"</div>
  <script type="module">
    import * as THREE from 'three';
    import { OrbitControls } from 'three/addons/controls/OrbitControls.js';
    import { mergeGeometries, mergeVertices } from 'three/addons/utils/BufferGeometryUtils.js';
    import Stats from 'three/addons/libs/stats.module.js';
    import { GUI } from 'three/addons/libs/lil-gui.module.min.js';

    const status = document.getElementById('status');
    const renderer = new THREE.WebGLRenderer({ antialias: true });
    renderer.setPixelRatio(Math.min(devicePixelRatio, 2));
    renderer.setSize(innerWidth, innerHeight);
    renderer.toneMapping = THREE.ACESFilmicToneMapping;
    document.body.appendChild(renderer.domElement);

    const scene = new THREE.Scene();
    scene.background = new THREE.Color(0x0d1017);
    scene.fog = new THREE.Fog(0x0d1017, 70, 160);
    const camera = new THREE.PerspectiveCamera(50, innerWidth / innerHeight, 0.5, 400);
    camera.position.set(0, 26, 52);
    const controls = new OrbitControls(camera, renderer.domElement);
    controls.enableDamping = true;
    controls.target.set(0, 0, 4);

    scene.add(new THREE.HemisphereLight(0xc4d6ff, 0x2a2420, 1.6));
    const sun = new THREE.DirectionalLight(0xffffff, 2.4);
    sun.position.set(30, 40, 15);
    sun.shadow.camera.left = sun.shadow.camera.bottom = -45;
    sun.shadow.camera.right = sun.shadow.camera.top = 45;
    sun.shadow.camera.far = 120;
    sun.shadow.bias = -0.0005;
    scene.add(sun);

    const ground = new THREE.Mesh(new THREE.PlaneGeometry(400, 400), new THREE.MeshStandardMaterial({ color: 0x1b202b, roughness: 1 }));
    ground.rotation.x = -Math.PI / 2;
    ground.receiveShadow = true;
    scene.add(ground);

    addEventListener('resize', () => {
      camera.aspect = innerWidth / innerHeight;
      camera.updateProjectionMatrix();
      renderer.setSize(innerWidth, innerHeight);
    });

    // Our own frame stats. renderer.info is reset at the start of every render(),
    // so we copy what we need right after rendering.
    const perf = { fps: 0, frameMs: 0, cpuMs: 0, calls: 0, triangles: 0 };
    let perfFrames = 0, perfCpu = 0, perfStart = performance.now();
    function timed(work) {
      const t0 = performance.now();
      work();                                   // our updates + renderer.render()
      perfCpu += performance.now() - t0;
      perfFrames++;
      perf.calls = renderer.info.render.calls;
      perf.triangles = renderer.info.render.triangles;
      const now = performance.now();
      if (now - perfStart >= 500) {             // average over half a second
        perf.frameMs = (now - perfStart) / perfFrames;
        perf.fps = 1000 / perf.frameMs;
        perf.cpuMs = perfCpu / perfFrames;
        perfFrames = 0; perfCpu = 0; perfStart = now;
        showStats();
      }
    }
    const fmt = (n) => n >= 1e6 ? (n / 1e6).toFixed(2) + ' M' : n >= 1e4 ? (n / 1e3).toFixed(1) + ' K' : String(Math.round(n));
    const timing = () => `frame      ${perf.frameMs.toFixed(1)} ms  (${perf.fps.toFixed(0)} fps)\nour JS     ${perf.cpuMs.toFixed(2)} ms per frame`;
    // ---- the field: N small objects in four shapes and six colours ----
    const box = new THREE.BoxGeometry(1, 1, 1);
    box.clearGroups();
    const SHAPES = [
      box,                                                          //  12 triangles
      mergeVertices(new THREE.IcosahedronGeometry(0.62, 1)),        //  80 triangles
      new THREE.TorusGeometry(0.42, 0.17, 10, 20),                  // 400 triangles
      new THREE.ConeGeometry(0.55, 1.1, 16),                        //  48 triangles
    ];
    const PALETTE = [0xff6b6b, 0xffd166, 0x06d6a0, 0x4cc9f0, 0x9b8cff, 0xf4f1ea].map((c) => new THREE.Color(c));

    // A seeded random generator, so every mode builds exactly the same field.
    function random(seed) {
      return () => {
        seed = (seed + 0x6d2b79f5) | 0;
        let t = Math.imul(seed ^ (seed >>> 15), 1 | seed);
        t = (t + Math.imul(t ^ (t >>> 7), 61 | t)) ^ t;
        return ((t ^ (t >>> 14)) >>> 0) / 4294967296;
      };
    }
    function makeItems(count) {
      const rnd = random(7), side = Math.ceil(Math.sqrt(count)), spacing = 80 / side, items = [];
      for (let i = 0; i < count; i++) {
        items.push({
          shape: Math.floor(rnd() * 4),
          color: Math.floor(rnd() * PALETTE.length),
          x: ((i % side) + 0.5 + (rnd() - 0.5) * 0.4) * spacing - 40,
          z: (Math.floor(i / side) + 0.5 + (rnd() - 0.5) * 0.4) * spacing - 40,
          size: spacing * (0.42 + rnd() * 0.18),
          phase: rnd() * Math.PI * 2,
          spin: rnd() * Math.PI * 2,
        });
      }
      return items;
    }

    // Where item i is at time t: it bobs up and down and turns slowly.
    const _p = new THREE.Vector3(), _q = new THREE.Quaternion(), _s = new THREE.Vector3(), _e = new THREE.Euler();
    function poseAt(item, t) {
      _p.set(item.x, item.size * (0.6 + 0.6 * (1 + Math.sin(t * 1.6 + item.phase))), item.z);
      _q.setFromEuler(_e.set(0.4, item.spin + t * 0.6, 0));
      _s.setScalar(item.size);
    }
    function matrixAt(item, t, target) {
      poseAt(item, t);
      return target.compose(_p, _q, _s);
    }
    // ---- 1. Naive: one Mesh per object ----
    // Geometries and materials are shared, which saves memory, but every Mesh is still its own draw call.
    const MATERIALS = PALETTE.map((color) => new THREE.MeshStandardMaterial({ color, roughness: 0.5 }));
    function buildNaive(items) {
      const group = new THREE.Group();
      const meshes = items.map((item) => {
        const mesh = new THREE.Mesh(SHAPES[item.shape], MATERIALS[item.color]);
        mesh.castShadow = true;
        group.add(mesh);
        return mesh;
      });
      const update = (t) => meshes.forEach((mesh, i) => {
        poseAt(items[i], t);
        mesh.position.copy(_p);
        mesh.quaternion.copy(_q);
        mesh.scale.copy(_s);
      });
      update(0);
      return {
        object: group,
        update,
        dispose() {},                           // nothing of its own: shapes and materials are shared
      };
    }
    // ---- 2. Merged: bake every object into one big geometry ----
    function buildMerged(items) {
      const matrix = new THREE.Matrix4();
      const parts = items.map((item) => {
        const part = SHAPES[item.shape].clone().applyMatrix4(matrixAt(item, 0, matrix));
        const colors = new Float32Array(part.attributes.position.count * 3);
        for (let v = 0; v < colors.length; v += 3) PALETTE[item.color].toArray(colors, v);
        part.setAttribute('color', new THREE.BufferAttribute(colors, 3));
        return part;
      });
      const geometry = mergeGeometries(parts);
      parts.forEach((part) => part.dispose());
      const material = new THREE.MeshStandardMaterial({ vertexColors: true, roughness: 0.5 });
      const mesh = new THREE.Mesh(geometry, material);
      mesh.castShadow = true;
      return {
        object: mesh,
        update() {},                            // frozen: the objects are now just triangles in one mesh
        dispose() { geometry.dispose(); material.dispose(); },
      };
    }
    // ---- 3. InstancedMesh: one geometry, drawn many times with different matrices ----
    // One InstancedMesh can only use one geometry, so we need one per shape: 4 draw calls.
    function buildInstanced(items) {
      const material = new THREE.MeshStandardMaterial({ roughness: 0.5 });
      const group = new THREE.Group(), meshes = [];
      const matrix = new THREE.Matrix4();
      SHAPES.forEach((shape, s) => {
        const mine = items.filter((item) => item.shape === s);
        const mesh = new THREE.InstancedMesh(shape, material, mine.length);
        mesh.instanceMatrix.setUsage(THREE.DynamicDrawUsage);   // we rewrite it every frame
        mine.forEach((item, i) => {
          mesh.setMatrixAt(i, matrixAt(item, 0, matrix));
          mesh.setColorAt(i, PALETTE[item.color]);
        });
        mesh.computeBoundingSphere();           // culling uses this; it is not updated for you
        mesh.castShadow = true;
        meshes.push({ mesh, mine });
        group.add(mesh);
      });
      return {
        object: group,
        update(t) {
          for (const { mesh, mine } of meshes) {
            mine.forEach((item, i) => mesh.setMatrixAt(i, matrixAt(item, t, matrix)));
            mesh.instanceMatrix.needsUpdate = true;
          }
        },
        dispose() { meshes.forEach(({ mesh }) => mesh.dispose()); material.dispose(); },
      };
    }
    // ---- 4. BatchedMesh: several geometries in one object, one draw call ----
    function buildBatched(items) {
      let vertices = 0, indices = 0;
      for (const shape of SHAPES) { vertices += shape.attributes.position.count; indices += shape.index.count; }
      const material = new THREE.MeshStandardMaterial({ roughness: 0.5 });
      const batch = new THREE.BatchedMesh(items.length, vertices, indices, material);
      const geometryIds = SHAPES.map((shape) => batch.addGeometry(shape));   // each shape stored once
      const matrix = new THREE.Matrix4();
      const ids = items.map((item) => {
        const id = batch.addInstance(geometryIds[item.shape]);
        batch.setMatrixAt(id, matrixAt(item, 0, matrix));
        batch.setColorAt(id, PALETTE[item.color]);
        return id;
      });
      batch.castShadow = true;
      return {
        object: batch,
        update(t) { items.forEach((item, i) => batch.setMatrixAt(ids[i], matrixAt(item, t, matrix))); },
        dispose() { batch.dispose(); material.dispose(); },
      };
    }
    // ---- the stress test ----
    const BUILDERS = { naive: buildNaive, merged: buildMerged, instanced: buildInstanced, batched: buildBatched };
    const params = {
      mode: 'instanced', objects: 5000, animate: true,
      shadows: false, pixelRatio: renderer.getPixelRatio(), perObjectCulling: true,
      benchmark: () => runBenchmark(),
    };
    let field = null, buildMs = 0, bench = null, benchRunning = false;

    function rebuild() {
      if (field) { scene.remove(field.object); field.dispose(); }
      const t0 = performance.now();
      field = BUILDERS[params.mode](makeItems(params.objects));
      buildMs = performance.now() - t0;
      if (field.object.isBatchedMesh) field.object.perObjectFrustumCulled = params.perObjectCulling;
      scene.add(field.object);
    }
    function applyShadows() {
      renderer.shadowMap.enabled = sun.castShadow = params.shadows;
      scene.traverse((o) => { if (o.material) o.material.needsUpdate = true; });
      MATERIALS.forEach((m) => m.needsUpdate = true);   // shared materials of the naive mode, even when not in the scene
    }

    const stats = new Stats();
    Object.assign(stats.dom.style, { left: 'auto', top: 'auto', right: '12px', bottom: '12px' });
    document.body.appendChild(stats.dom);

    function showStats() {
      let text =
        `<b>${params.mode}</b>, ${params.objects.toLocaleString('en-US')} objects${params.shadows ? ', sun shadows' : ''}\n` +
        `draw calls ${perf.calls}\n` +
        `triangles  ${fmt(perf.triangles)}\n` +
        `geometries ${renderer.info.memory.geometries}\n` +
        `built in   ${buildMs.toFixed(0)} ms\n` +
        (params.mode === 'merged' ? `<b>merged:</b> one mesh cannot move its parts\n` : '') +
        `\n` + timing();
      if (bench) {
        text += `\n\n<b>benchmark</b>, ${bench.objects.toLocaleString('en-US')} objects${benchRunning ? ' (running…)' : ''}\n` +
          `mode        calls   frame ms   our JS ms\n` +
          bench.rows.map((r) => `${r.mode.padEnd(10)} ${String(r.calls).padStart(6)} ${r.frameMs.toFixed(1).padStart(10)} ${r.cpuMs.toFixed(2).padStart(11)}`).join('\n');
      }
      status.innerHTML = text;
    }

    // Run each mode for a moment and keep the averages.
    const wait = (ms) => new Promise((resolve) => setTimeout(resolve, ms));
    async function runBenchmark() {
      if (benchRunning) return;
      benchRunning = true;
      const before = params.mode;
      bench = { objects: params.objects, rows: [] };
      for (const mode of Object.keys(BUILDERS)) {
        params.mode = mode;
        gui.controllersRecursive().forEach((c) => c.updateDisplay());
        rebuild();
        await wait(1200);                       // warm up: upload buffers, compile shaders
        bench.rows.push({ mode, calls: perf.calls, frameMs: perf.frameMs, cpuMs: perf.cpuMs });
      }
      params.mode = before;
      gui.controllersRecursive().forEach((c) => c.updateDisplay());
      rebuild();
      benchRunning = false;
      showStats();
    }

    const gui = new GUI({ title: 'Stress test' });
    gui.add(params, 'mode', Object.keys(BUILDERS)).onChange(rebuild);
    gui.add(params, 'objects', [1000, 2000, 5000, 10000, 20000, 50000]).onChange(rebuild);
    gui.add(params, 'animate');
    gui.add(params, 'shadows').name('sun shadows').onChange(applyShadows);
    gui.add(params, 'pixelRatio', 0.25, 2, 0.25).name('pixel ratio').onChange((v) => { renderer.setPixelRatio(v); renderer.setSize(innerWidth, innerHeight); });
    gui.add(params, 'perObjectCulling').name('batched: per-object culling').onChange(() => {
      if (field.object.isBatchedMesh) field.object.perObjectFrustumCulled = params.perObjectCulling;
    });
    gui.add(params, 'benchmark').name('benchmark all modes');
    rebuild();

    let t = 0, last = 0;
    renderer.setAnimationLoop((time) => {
      const dt = Math.min((time - last) / 1000, 0.1);
      last = time;
      if (params.animate) t += dt;
      controls.update();
      timed(() => {
        if (params.animate) field.update(t);
        renderer.render(scene, camera);
      });
      stats.update();
    });
  </script>
</body>
</html>
The step-by-step versions are in the repo too: step-1.html (renderer.info, stats.js and our own timer), step-2.html (naive meshes and merging), step-3.html (plus InstancedMesh), step-4.html (plus BatchedMesh, with per-object culling and sorting), step-5.html (LOD and frustum culling), step-6.html (pixel ratio, textures, mipmaps and shadow cost) and step-7.html (dispose() and rendering on demand).
A few things to try
- In the stress test, find the object count where naive mode drops below 60 fps on your machine. Then switch to batched and keep doubling until it drops too.
- Move the pixel ratio slider in naive mode and in batched mode. In which one does it change the frame time more? That tells you which one is CPU-bound.
- In step 3, set
mesh.count = 100on eachInstancedMeshinupdate(): the rest disappear without reallocating anything. - In step 4, use
batch.setVisibleAt(id, false)to hide every second object, andsetGeometryIdAtto turn all the tori into boxes. - In step 5, change the LOD distances to 6 and 12 with tint on, and watch the colour bands move toward the camera. How close can they come before you see the switch without the tint?
- In step 6, set
renderer.shadowMap.autoUpdate = falsewith the sun shadow on and the animation running: the shadows freeze where they were. - In step 7, open Chrome's Task Manager (Shift+Esc) and compare the GPU memory of the tab with dispose on and off.
- Record the stress test with Chrome DevTools in naive mode, then in batched mode, and compare the Main track.
Next time
We can now measure a frame and make it cheaper: fewer draw calls with merging, instancing and batching, fewer triangles with LOD and culling, fewer pixels, smaller textures, fewer shadow passes, no leaks and no wasted frames. So far, though, users could only orbit the camera. In Part 8 we make scenes interactive and physical: picking objects with the mouse using Raycaster (including instances of an InstancedMesh), dragging them around, and adding a physics engine, Rapier, so that thousands of instanced objects fall, collide and stack. See you there.